
Worked example
Revenue is flat, profit is down: investigating margin with AI
A worked example of investigating a margin decline, comparing channels and checking missing evidence before attributing a cause.
Rumbleo team Updated
Choose the comparison first
Revenue has not moved, yet less money remains. Before asking an assistant to explain it, agree on the comparison. Gross margin or operating profit? A full month or month to date? Revenue after returns?
This fictional example uses two comparable full periods. Revenue is net of discounts and returns, excluding taxes. Cost includes the products sold, but excludes rent and payroll. We are therefore examining gross margin. This is not a Rumbleo customer case study.
Quantify the decline
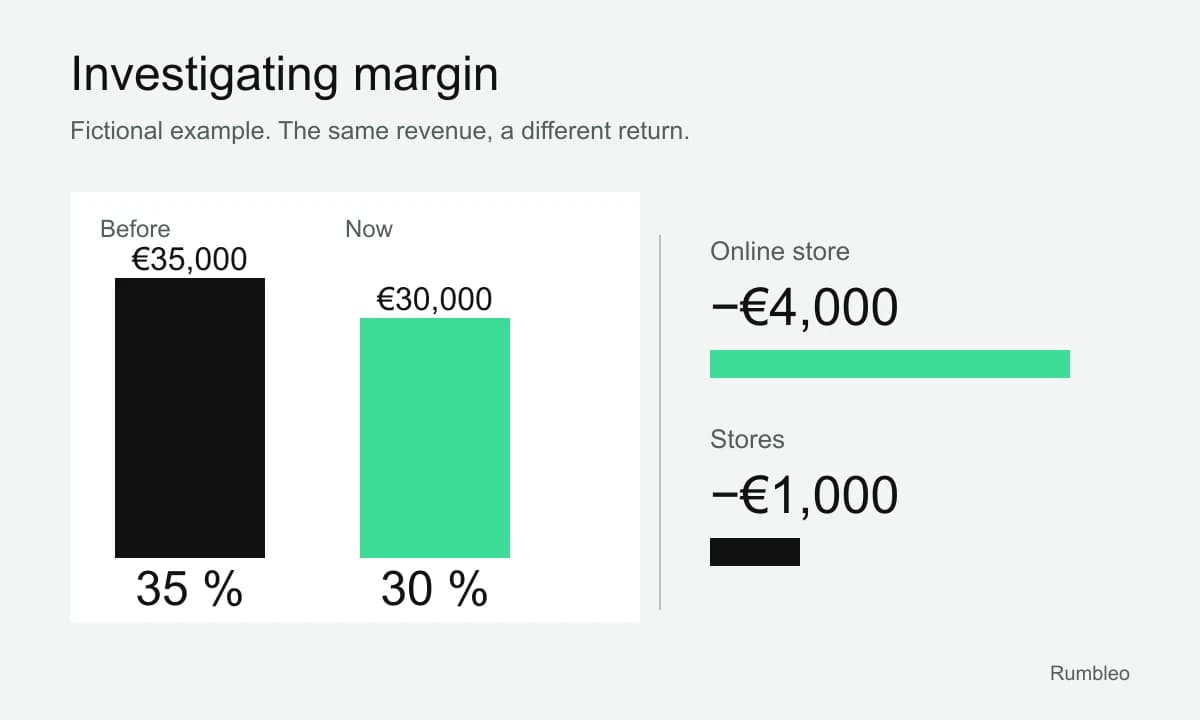
Revenue is €100,000 in both periods. Product cost rises from €65,000 to €70,000. Gross profit falls from €35,000 to €30,000, and gross margin falls from 35% to 30%. That is five percentage points, not a 5% decline in profit.
A useful first question is: compare revenue, product cost, and gross margin by channel for both periods, with the same filters.
| Channel | Revenue in each period | Previous gross profit | Current gross profit | Change |
|---|---|---|---|---|
| Online | €50,000 | €20,000 (40%) | €16,000 (32%) | −€4,000 |
| Stores | €50,000 | €15,000 (30%) | €14,000 (28%) | −€1,000 |
| Total | €100,000 | €35,000 (35%) | €30,000 (30%) | −€5,000 |
Narrow it down before explaining it
Online accounts for €4,000 of the €5,000 loss: 80% of the decline. That tells us where to investigate. It does not establish that discounts caused the loss. Revenue could be flat because more units sold at lower prices, the product mix changed, or purchase costs increased.
The next question can break online down by product or category. Keep the total in view to reconcile the segments. If a join between orders and order lines duplicates amounts, any explanation based on those figures will be wrong.
What is missing from a causal explanation
Separating price, volume, mix, and cost requires quantities, revenue, and cost at compatible levels of detail. Decide how to handle new products, late returns, and currency changes. The table above locates the decline, but cannot reliably allocate it among those drivers.
Saying that a promotion caused the loss requires further evidence. Comparing periods may reveal an association; establishing causality requires an analysis designed to rule out other explanations.
What to bring to the meeting
The useful output is a short explanation of the total change, the channel that accounts for it, and the checks still needed. Here: gross profit fell €5,000; online accounts for €4,000; price, units, and cost still need to be separated by product.
In Rumbleo, these questions use the company's business definitions and a read-only analytical connection. People should review the results before changing prices or withdrawing a campaign.
- Confirm periods and the margin definition
- Reconcile the detail to the €5,000 decline
- Investigate online by product
- Review discounts and costs before acting